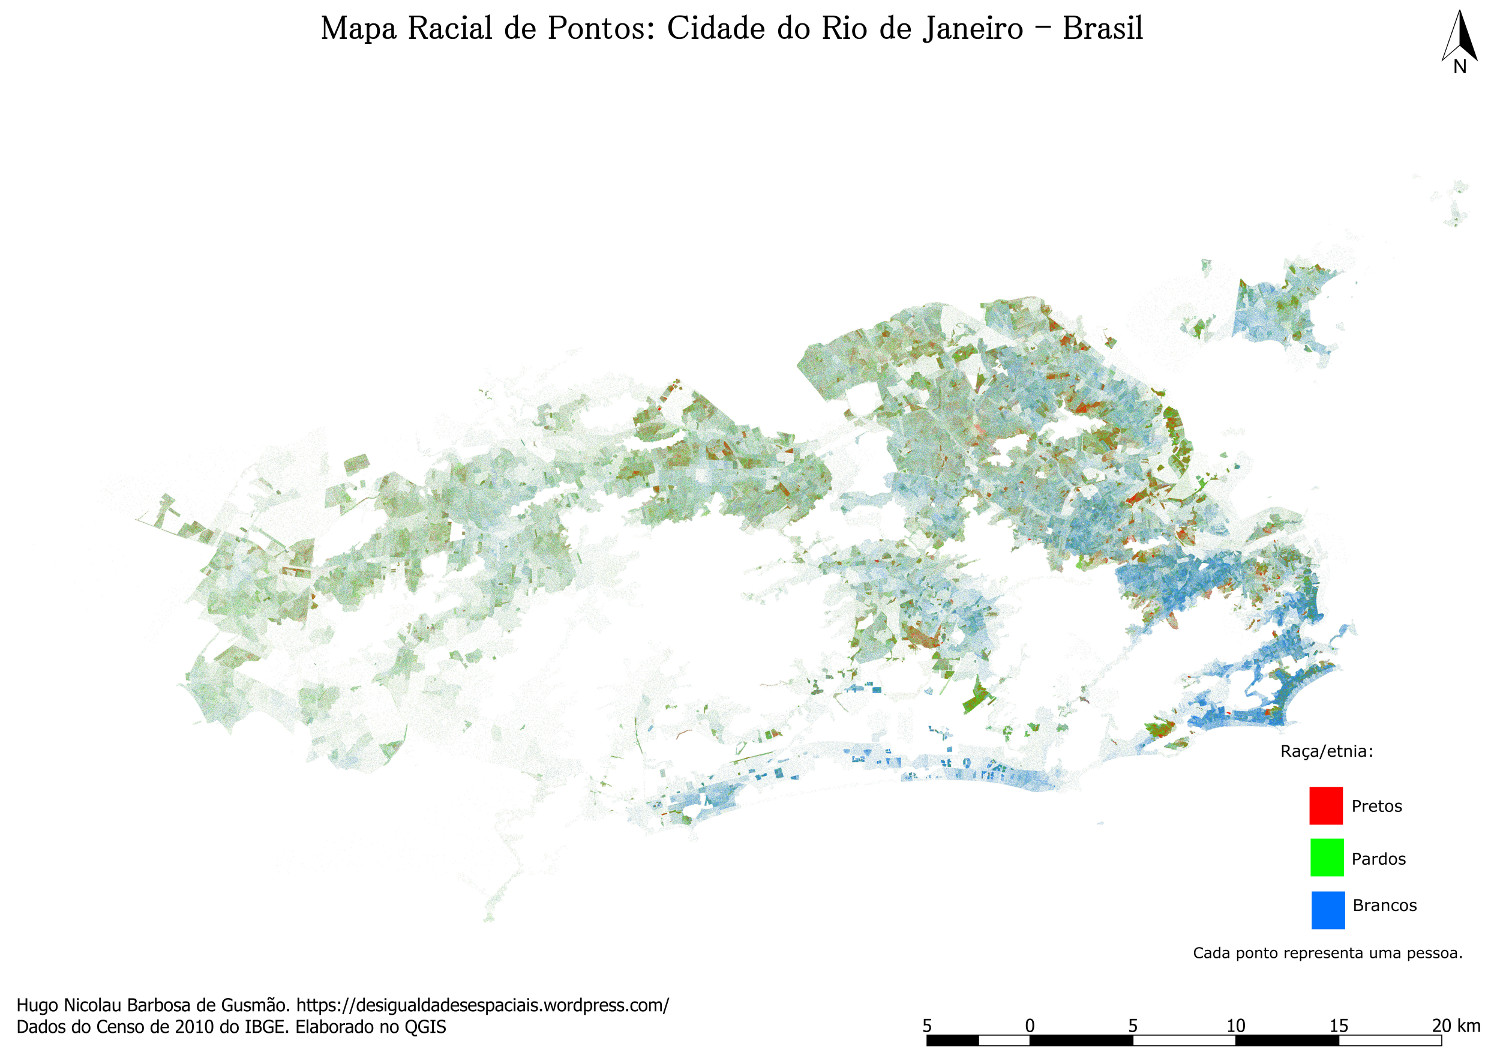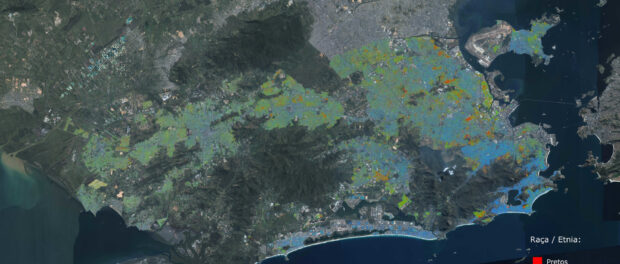
A new series of maps and infographics show the stark racial segregation of the city of Rio de Janeiro. São Paulo geography student Hugo Nicolau Barbosa de Gusmão developed the maps after seeing the detailed maps of racial segregation in US cities and couldn’t find any similar illustration of race and geography in Brazilian cities. Using data from the latest 2010 census, Barbosa first mapped racial distribution in the South Zone and was featured in The Global Post. Last week he published maps which detail the racial distribution across the whole city region, illustrating the racial divide which marks the city.
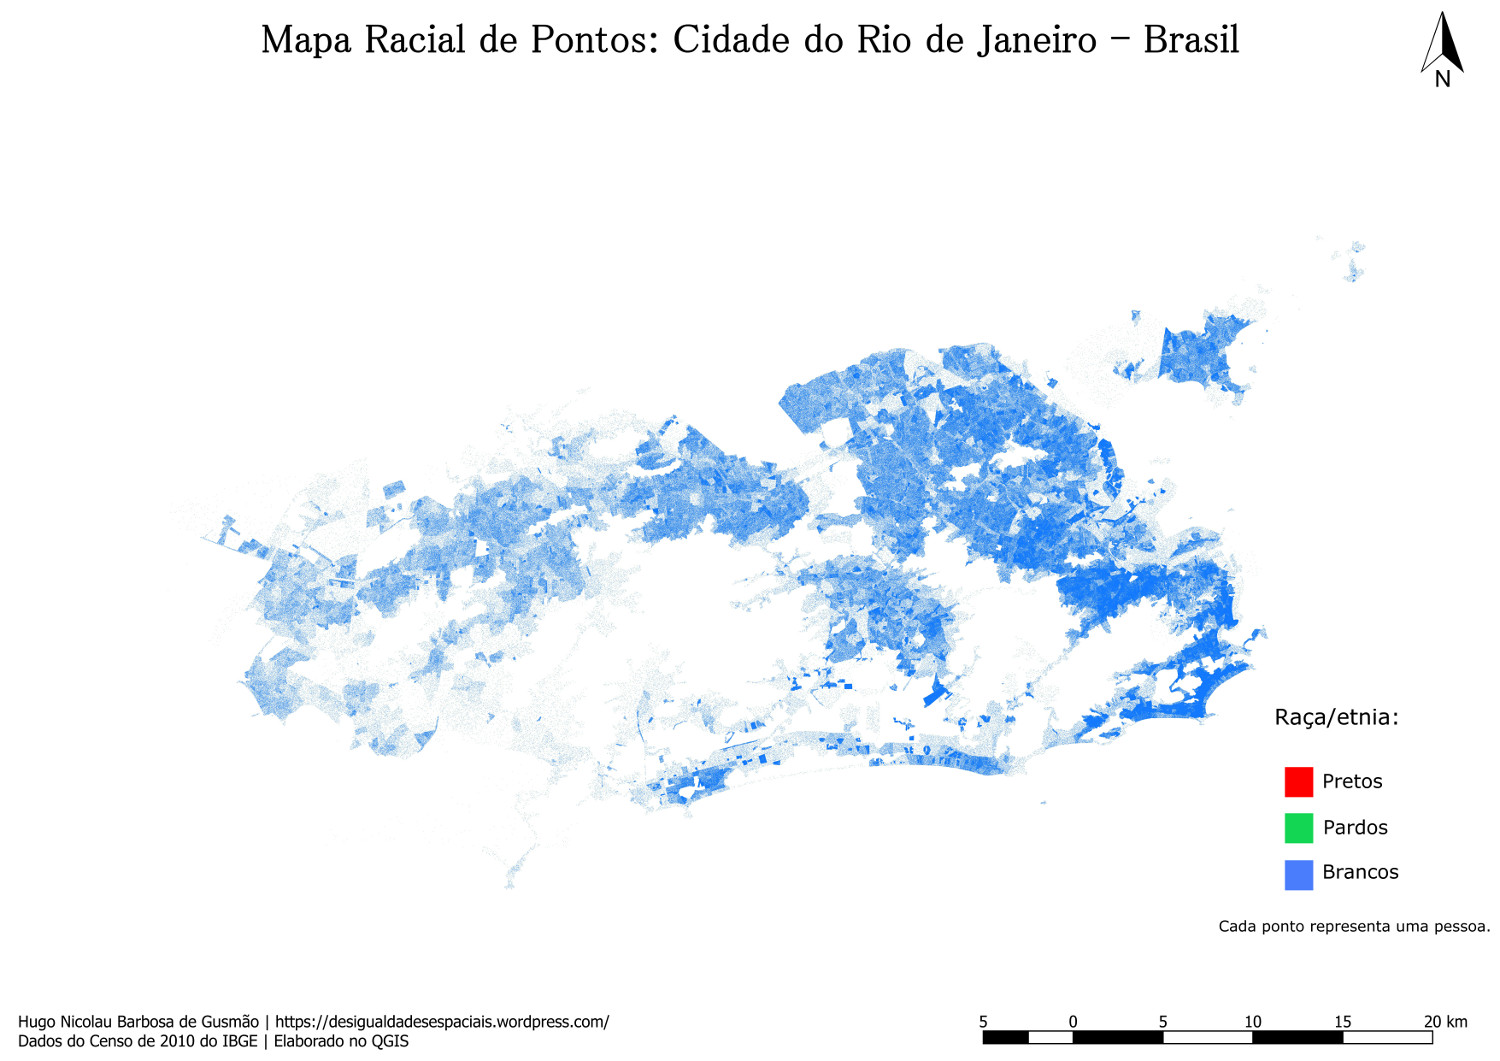
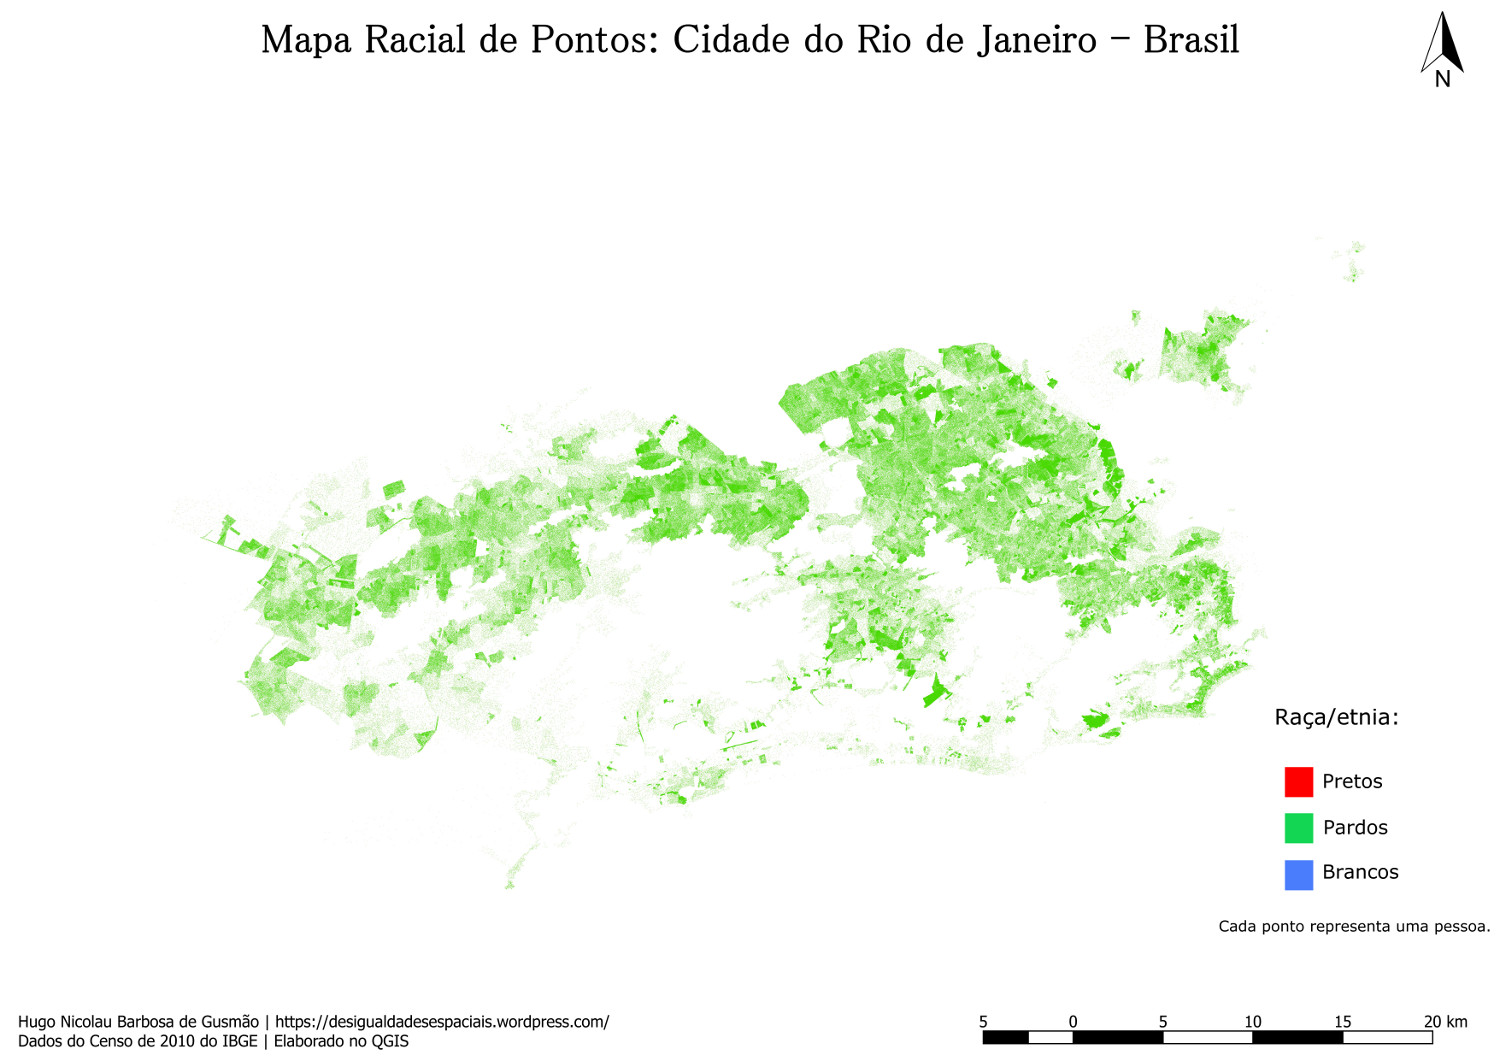
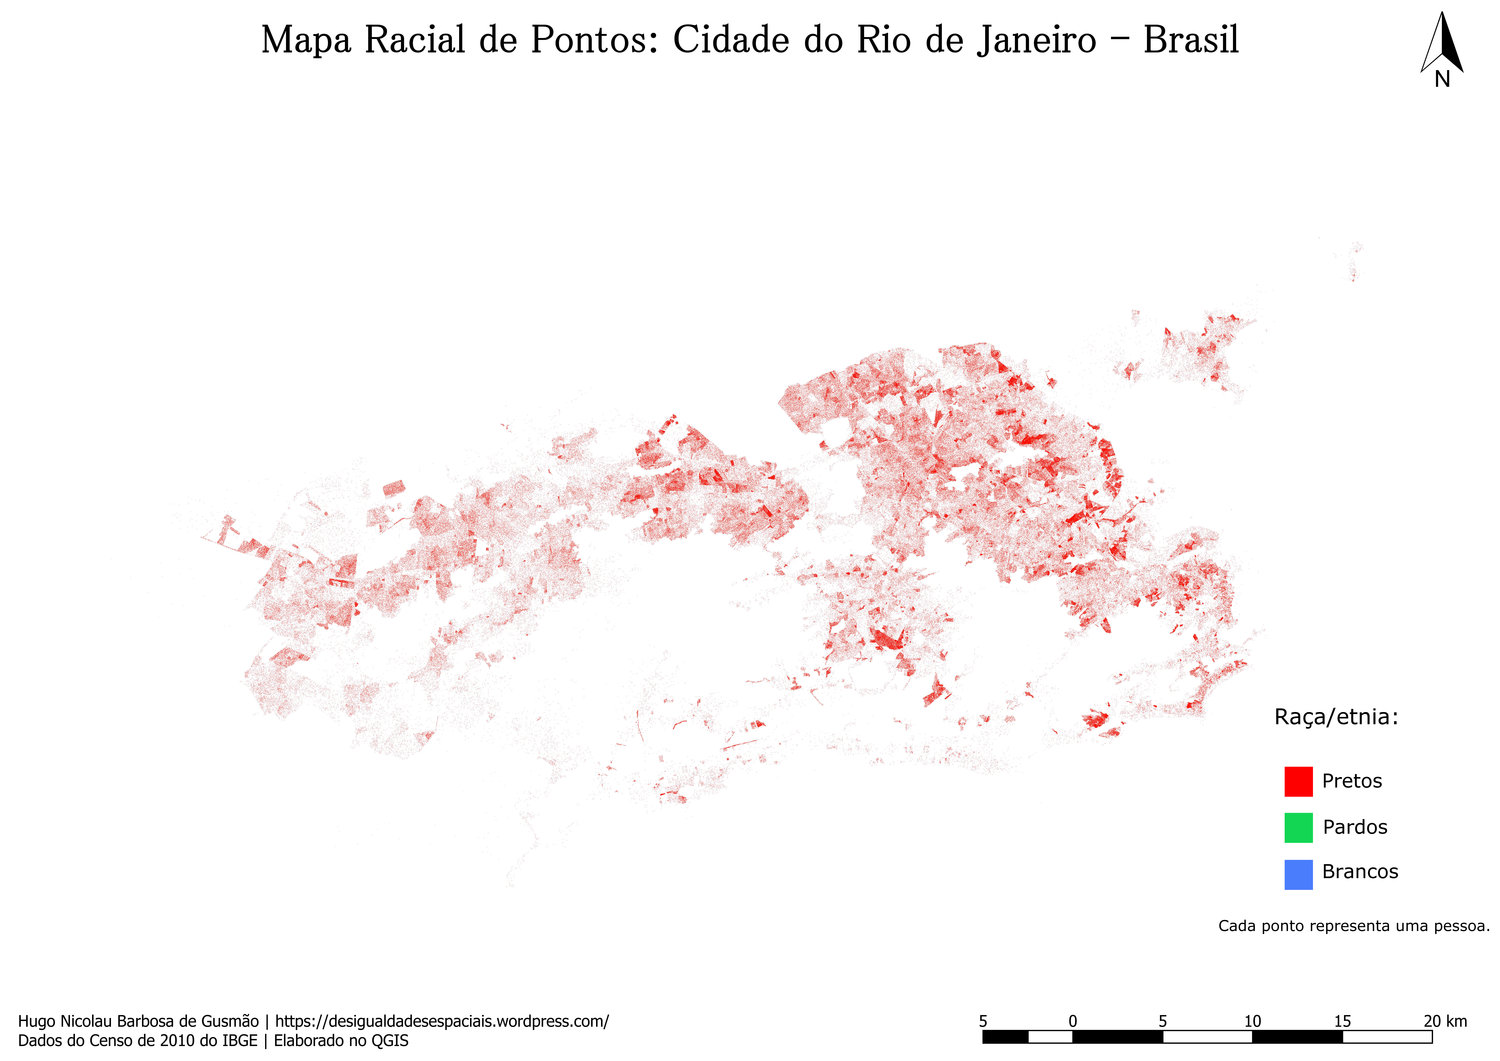
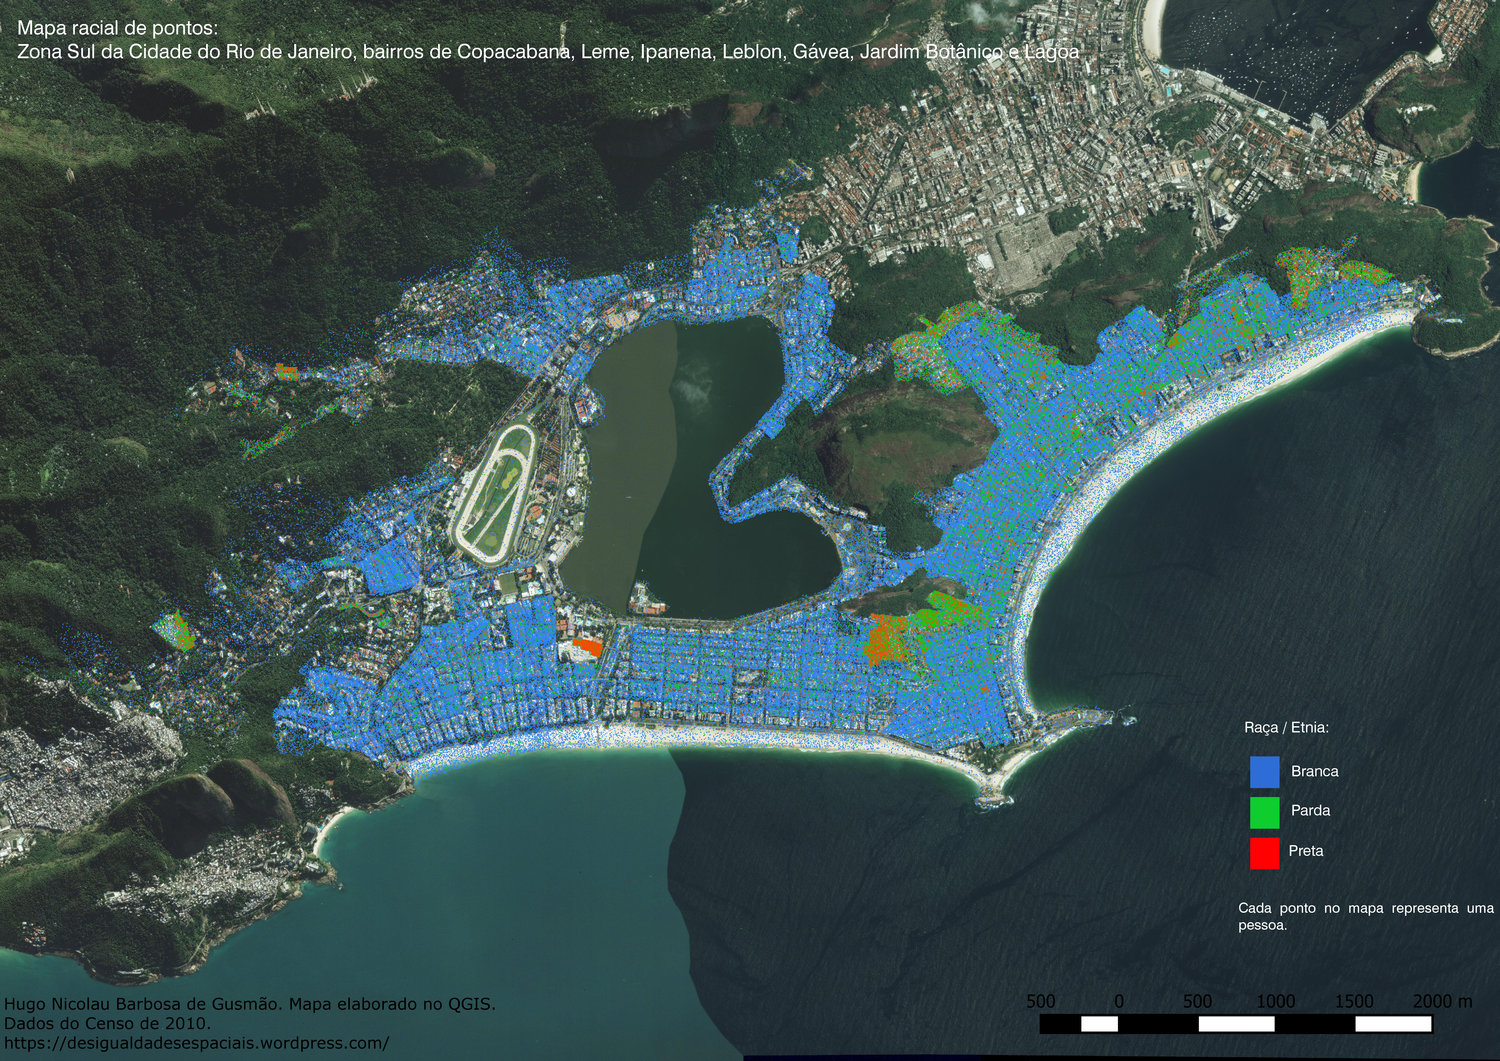
Published on Barbosa’s blog Desigualdades Espaciais (Spacial Inequalities), the maps show the distribution of three racial categories: whites are mapped in blue; pardos – the Brazilian term for brown or mixed race – are shown in green; blacks are shown in red.
Though caucasians are spread out across the city, there is an intense concentration in the affluent, beachside South Zone neighborhoods. Barbosa found that the South Zone is 80% white; Rio’s richest neighborhood Lagoa is 90% white. This contrasts starkly with the racial profile of the city as a whole, which is 50% black or mixed-race.
The distribution of brown or mixed race people is spread across the poorer North and West Zones:
The distribution of blacks is largely in the North and West Zones, with points of concentration across the city which can be identified as favelas:
In his post on the South Zone maps, Barbosa wrote: “We can see from the maps that blacks and browns are concentrated in small areas which are mostly favelas while the distribution of whites is uniform and occupies the whole territory. From this we can understand the Rio de Janeiro government’s [recent] policy of stopping blacks and mixed-race youth going to beach as one to maintain the racial segregation that already exists in Rio de Janeiro.”
The maps provide a compelling visual representation of the racial inequalities that exist in the city. The concentration of whites in rich areas and blacks in poor areas point to the continuation of a long history of racial segregation which has roots in Rio’s brutal history of slavery. The criminalization of poor, black, favela residents, evidenced by the recent policy of stopping black youth from the North Zone visiting the beach and bus changes limiting North and West Zone access to the South Zone, cements the spatial inequalities and exclusion experienced by the city’s black and mixed-race population. The maps of the racial distribution of the city give a clear picture of how race and geography are interlinked in Rio.

