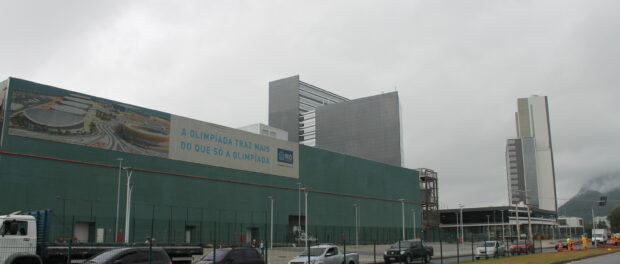
A huge sign at the Olympic Park in Barra de Tijuca in the West Zone of Rio de Janeiro reads: “The Olympics bring much more than just the Olympics.” What this “much more” entails has been a point of contention between Mayor Eduardo Paes and residents of the city. Paes points to expanded transportation in the form of a dedicated bus rapid transit system, light rail in the city center, and a new subway line connecting Ipanema in the South Zone and Barra de Tijuca as examples of the Games’ legacy. Activists argue that the Olympics have been used by the city to bring even more exclusion and inequality pointing out that these transport investments were focused on the already affluent parts of the city. Local and international human rights groups cite the tens of thousands of evictions, like those right next to the sign at Vila Autodrómo, and more killings by the police of young, mostly black favela residents as the Games’ unfortunate, but true legacies.
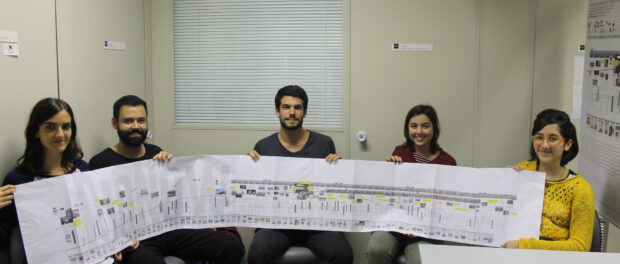
With the Games underway, a group of undergraduate students from the Pontifical Catholic University’s (PUC) Department of Architecture and Urbansim have launched the website RioNow.org to showcase their research into what changes the Olympics have brought Rio de Janeiro. Its main feature is a timeline beginning in October 2009 when Rio won the Olympic bid. But more than just document the buildings and infrastructure projects ushered in by the 2014 World Cup and 2016 Olympic Games, the timeline uses multiple sources to showcase the complex transformations happening in both Rio and Brazil. “We tried to make a tool that allows for a multifaceted reading of this whole process,” explains Architecture and Art History Professor Ana Luiza Nobres, who led the research team.
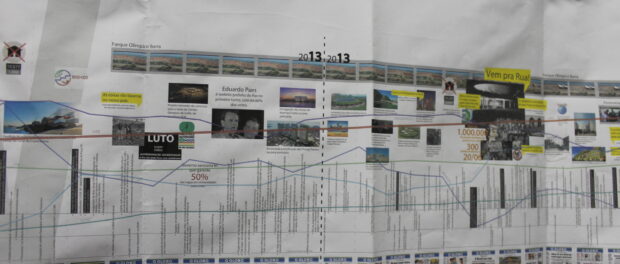
Relevant front page images from each month since October 2009 from O Globo, the major national newspaper with a particular stronghold in Rio where its headquarters are based, trace the elite narrative of the social, political, and economic changes in the city. A November 2010 headline refers to major police operations in Vila Cruzeiro and Complexo de Alemão in the North Zone as a “D Day of the War on Drugs.”
Rio, like many other cities who bid for the Olympics, promised that the Games would bring foreign investment and increased economic prosperity. To track this, the timeline also graphs economic indicators including national unemployment, GDP, the Brazilian stock market BOVESPA, market prices, the exchange rate with the dollar, and the price of real estate in Rio de Janeiro. For example, real estate prices skyrocketed between 2009 and 2014 before leveling off.
The timeline also features images of the launches of major construction and architecture projects like the opening of the Niemeyer footbridge in Rocinha, and a time lapse of the changes in both the Olympic Park in Barra de Tijuca and the demolition of the elevated highway as part of the revitalization of the Port Area. Statements from government, FIFA and Olympic officials are highlighted in yellow, giving a sense of the changing political climate. And major events in Rio and Brazil, from the military occupation of Maré to the impeachment process of President Dilma Rousseff, serve as another axis to understand the changing physical and social landscape over the course of the last seven years.
There are two sets of numbers charting removals, those of the government and those of monitoring organizations like the Popular Committee on the World Cup and Olympics. The two sets of numbers represent a major find of the study: how difficult it is to uncover information. “A big part of our research was finding information. Information that should be public. Knowing how many people have been removed for example, nobody has this information,” said Nobre.
The city claims publicly only 4,772 families were removed for the Olympics, while their own data shows 20,000 families or 77,000 people were removed in pre-Olympic Rio. Because of the lack of transparency, the team relied heavily on other academic research like that of Lucas Faulhaber which uses the 77,000 figure to show not only the number of people removed but where they ended up, often in Rio’s far, militia controlled West Zone.
“Evictions were already an issue, but they became so much more prevalent. It’s an issue we witnessed because of our close relationship with Vila Autódromo following this whole process,” stated Nathalia Perico, a PUC architecture student.
As students of architecture, a field that straddles the social and the aesthetic, they also included the major art exhibitions that took place in Rio during the past seven years. “We wanted to show that what was going on in terms of culture and artistic events was completely disconnected from this process,” explains Zeca Osorio, one of the students who worked on the site. “We were able to find very few examples of exhibitions or events that in some way discussed this process of change.” One of the few artists that stood out to them was Igor Vidor, who lifted weights amid the bulldozed houses of Vila Autódromo to represent the number of people removed for the Olympic Park.
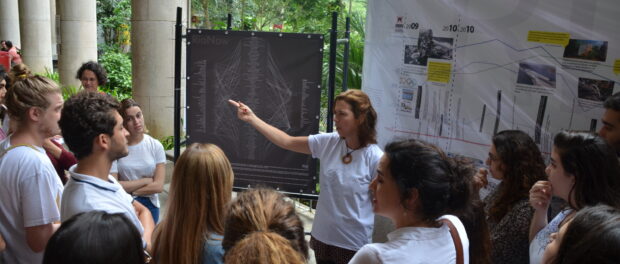
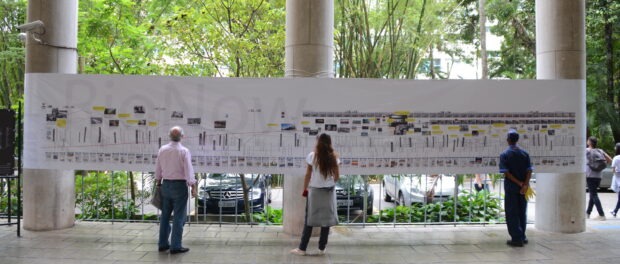
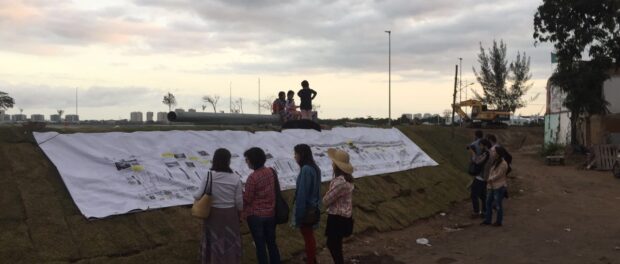
Before making the timeline available via Rionow.org, the group displayed it as a 10 meter banner at PUC and in Vila Autódromo. The scale allows the viewer to physically contend with the sheer magnitude of the changes that have taken place since October 2009.
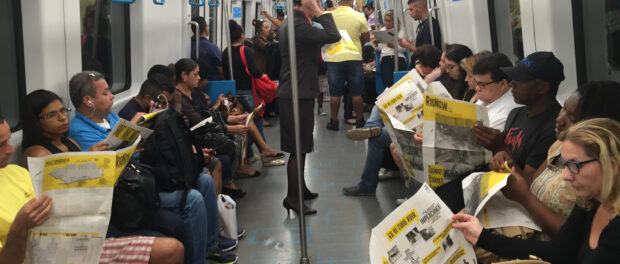
The students have also produced a newspaper, available on the site, that they have been distributing at key moments during the Games. The newspaper, written in both English and Portuguese, highlights many of the findings of the study and features a condensed version of the timeline between 2015 and 2016. On August 14 they will distribute it at the Olympic Park in Barra da Tijuca, and on August 21 near the Olympic marathon.
RioNow.org also features a list of the 100 buildings and urban revitalization projects with the most public impact built during the run up to the Games. The list shows architecture firms on the left, the projects in the center, and the construction firms who carried out the projects on the right. Despite the simple layout, the list shows how complicated these relationships actually are and the difficulties in uncovering who is responsible for many of these legacy projects. They said they even went to sites to look for plaques detailing the companies involved which only led to question marks when it comes to the firms responsible. The entangled design prompts viewers to engage in this same process of uncovering information.
The complication stems in part from the federal Special Regime for Contracting law. The law’s initial purpose was to speed up construction related to the 2014 World Cup and 2016 Olympics, allowing public officials to bypass regulations in public and semi-public projects, though it has been extended to include Growth Acceleration Program (PAC) projects. Instead of going to architecture firms, construction companies, many of which donate to politicians and parties, often obtained contracts without going through the normal bidding process. The law has been criticized for contributing to the Car Wash and other corruption scandals.
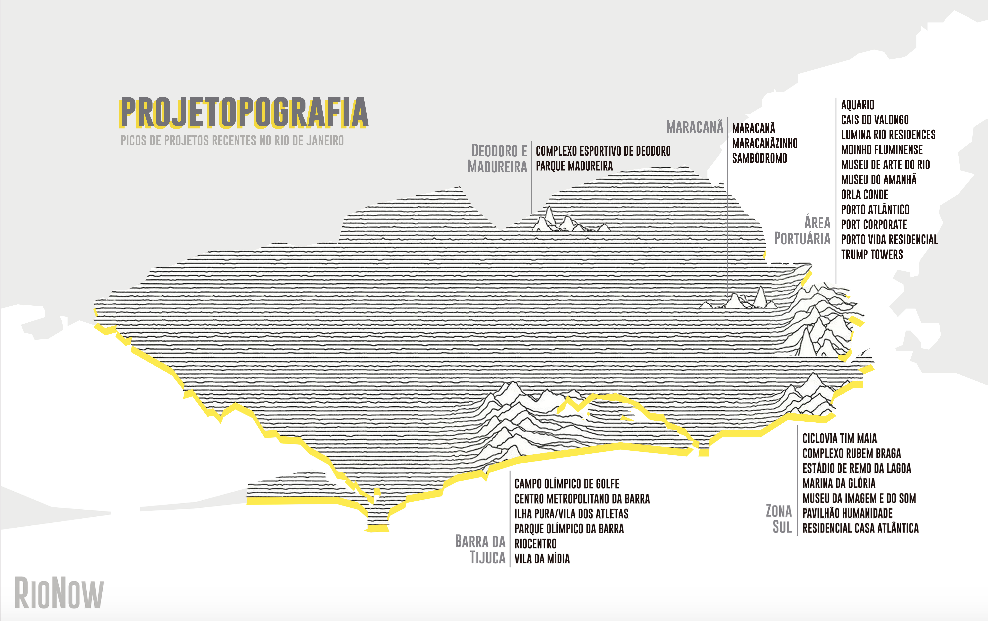
The site also includes a topographic map where the peaks represent places with the most infrastructure, architecture, and urban renewal projects, primarily in Barra de Tijuca and the Port Zone. Very little went to the North and West Zones, where most of the city’s population lives and many of those displaced have ultimately ended up.
Taken together, the site is a tool kit not only for researchers, but for residents to understand the changes that have taken place in their city. “It’s a testament to the speed of this project [to prepare the city for mega-events]. Urgency dominated this whole process. When you live it you don’t have a very good idea, but when you see everything, you think, ‘whoa,’ it passed from a boom, from an enormous euphoria in 2010, 2011, 2012 to a downfall and slowing down. It shows the pressure involved in this whole process, ” reflects Nobre. “There are six to seven years to transform your society, to make it a postcard and attract tourists from around the word, so what is the planning behind all this? How well do we know our society to do all this? These tools allow us to understand how much our work as architects, urbanists, a school, is limited and how impotent we are in the face of a ‘savior’ process. So we ask, what city will result from this, what legacy is there, what kind of legacy is this from a social point of view?”

