

During the first few months of 2019, the city of Rio de Janeiro experienced two major rainfall events that led to a total of 17 deaths and left hundreds homeless. With sequential rain disasters becoming increasingly commonplace, Rio de Janeiro is already experiencing dramatic impacts from climate change. In the wake of these perennial events, proper landslide and flood mitigation and prevention has gained heightened attention (attention alarmingly unmatched by government budgets).
This series on rainfall disaster risk and mitigation sheds light on the natural disaster prevention systems currently in place in Rio and their effects on communities across the city. Below is part one, taking a close look at the definition of risk and the history of landslide and flash flood prevention and warning tactics in place, namely the “Community-Based Alert and Alarm System.”
Measuring Risk
Within the context of natural disaster policy, favelas are often dubbed “high-risk.” For more on the inequalities that lead them to end up occupying such areas, and how they oftentimes work to reduce this risk, click here.
The phrase “risk area” can be found attached to favelas in several municipal policy documents, including City Hall’s Contingency Plan, which outlines the siren system’s functions and locations, and the Rio’s geotechnical institute Geo-Rio’s Risk Management Plan. The latter document presents five steps for “eliminating areas of high risk on mapped slopes”:
- Knowledge: Includes a mapping of all risk areas in the city (last completed in 2011) and slope susceptibility (using thematic maps, aerial photos, and lasers).
- Prevention: Includes the creation of Alerta-Rio (telemetric rain gauge network that began in 1996), the addition of a meteorological Doppler radar in 1999, emergency shelter points, community leader training, Rio’s Center of Operations (COR), and audible alert/alarm levels added in 2011.
- Diagnostics: Includes the development of mitigation projects in 117 communities designated as high-risk and the division of 112 communities into 10 regional sections.
- Intervention: Refers to methods and protocol for slope containment constructions, with a reported budget of R$83 million (US$21 million) for 2001-2008 and R$320 million (US$80 million) for 2009-2012.
- Monitoring: Drones, barometers, rain gauges, tracking with GPS, meteorological/weather stations with audio and video in real-time.
Below is a figure of all risk areas, high, medium and low, as mapped by Geo-Rio in 2011. According to this assessment, 117 communities are at a high-risk for natural disasters.

High-risk locations are areas considered most vulnerable to natural disasters. Many favelas in Rio are situated on the hillsides of the Tijuca Massif, and geographical conditions make some vulnerable to landslides. Social conditions like rapid urbanization, improper public sewerage and water infrastructure, and stigma that breeds disinvestment can create, exacerbate or perpetuate the risk faced in these communities.
More on Risk
Merging geographical and population data, the Brazilian Institute for Geography and Statistics (IBGE) along with the National Center for Natural Disaster Monitoring and Alerts (CEMADEN), which monitors 958 municipalities for natural disasters in Brazil, developed a method for assessing an area based on geographic and socioeconomic conditions, associating features of risk areas to census tracts. Called the Base Territorial Estatística de Áreas de Risco, or BATER method, the tool was created following the devastating landslides of 2011, and is defined as “a series of integrated maps, systems, and databases built according to proprietary methodology to give organizational and spatial support to operational planning, collection, and verification of data and dissemination of results from the Demographic Census.” BATER takes data from census tracts and combines it with 2011 risk-mapping to generate a result based on both technical and social aspects of a community. Most recently conducted in 2018, the goal of the BATER method is to include characteristics of the population most exposed to disaster risk in the 2020 Demographic Census. BATER data are made available for other municipalities to consider when developing environmental disaster policy, but are not widely used in legislation.
Rain Gauges and Sirens
 In 1996, a series of major landslides hit the city of Rio de Janeiro, several inside the Tijuca Massif, a series of hills in the heart of Rio de Janeiro which separate the city’s South Zone from its West Zone. The result of over 350mm of rain in 48 hours, the landslides led to the death of 44 people and destruction of 222 homes. In response, Geo-Rio installed a watch system called Rio Alert (Alerta-Rio). A project born of a 1980s landslide mitigation pilot program in Rio called SIGRA, Alerta-Rio began with the implementation of 30 rain gauges throughout the city, pictured to the right, and one automatically instrumented slope at Itanhangá Hill. Since the cost of placing instruments on several slopes would be too high and the data too varied for an area as expansive as Rio de Janeiro, the program employed only the single slope. The program’s rain gauges, meanwhile, measure the cause, rather than the effect, of landslide events.
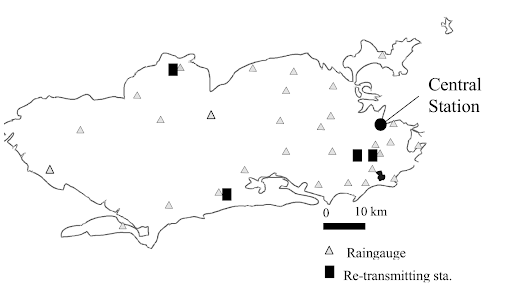
Beginning operations in December 1996, these gauges were put in place in accordance with Rio risk areas, recording levels of precipitation in their respective zones and transmitting data to a computer-networked Central Station at 15-minute intervals. Below is a map from 2001 showing the locations of the 30 gauges.
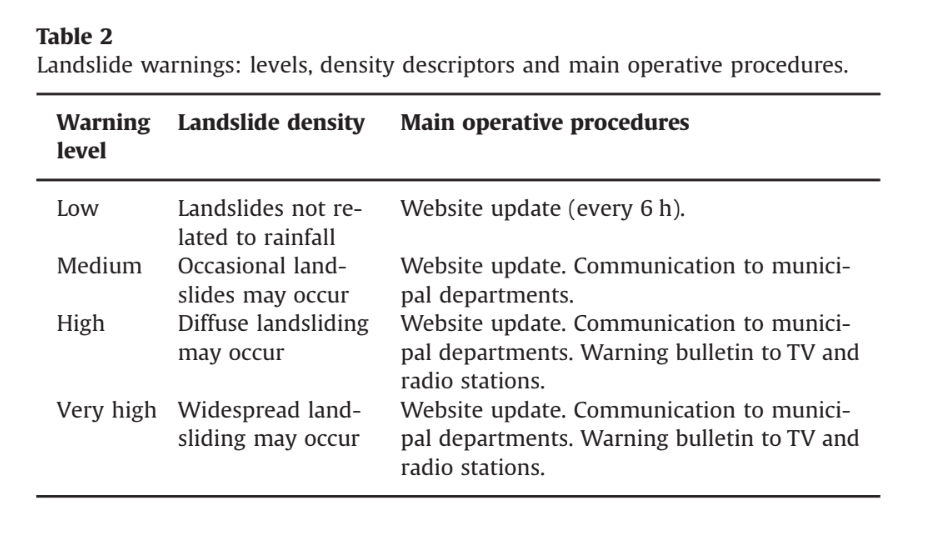
In setting precipitation threshold levels for the gauges—the level of rain at which a landslide becomes possible—Geo-Rio used a 1997 study by D’Orsi et al (published in Book 2 of the Pan-American Symposium on Landslides) establishing the relationship between landslides and rainfall in Rio based on 65 landslides and 5 gauges. In 2001, the daily threshold was 180mm of water in under 24 hours, and according to the most recent data, it is now 125mm in under 24 hours. The Alerta-Rio system contains four alert levels for landslide risk: low, medium, high, and very high. A study on the efficiency of the system in 2014 produced the table below, describing the different levels and subsequent agency actions.
In 1999, Geo-Rio enhanced its warning system with the addition of a Doppler radar, geostationary infrared satellites for 24-hour data, and a team of meteorologists analyzing weather data in three phases: regional-scale analysis (data from the Internet), mesoscale analysis (data from the gauge and site), and a comparison between the two sets of predicted and actual rainfall level throughout the entire gauge network.
During the first few years of the watch system, information from the gauges would only be transmitted to people working in Geo-Rio as meteorologists or engineers. However, in 1999, the Intense Rain Monitoring Plan was initiated as a citywide policy to determine different criteria for the gauge thresholds across the city, and Alerta-Rio was upgraded to a severe weather warning system, providing weather data to both the general public and other organizations. This increase in access triggered a shift in system management and perspective from a technical to a more social approach. While in 2010 only trained presidents of favela resident associations would receive SMS text messages from the Civil Defense about threatening weather conditions (page 5), currently, Rio’s City Hall website features a section on a free SMS service, allowing anyone to receive strong rain alerts (last updated in 2019).
Rio’s current City Hall website includes a newer list of high-risk areas, last updated in 2013, as well as maps of all 117 areas, a Contingency Plan for natural disaster protocol, along with an explanation of Alerta-Rio and a downloadable PDF. The map below illustrates the assessment of a section of the Complexo do Alemão favelas of Rio’s North Zone. Green designates low risk, yellow is medium, and red means high risk. There are two sirens (as indicated by the S1 and S2 siren icons) and four emergency gathering points (as designated by P1, P2, P3, and P4 house icons) distributed across the area.

Alerta-Rio also has its own website, which includes a section on real-time weather conditions, landslip probability, and a summation of the different levels of risk as well as the division of the areas into four river basins (Baía de Guanabara, Baía de Sepetiba, Bacia de Jacarepaguá, and Bacia de Zona Sul).
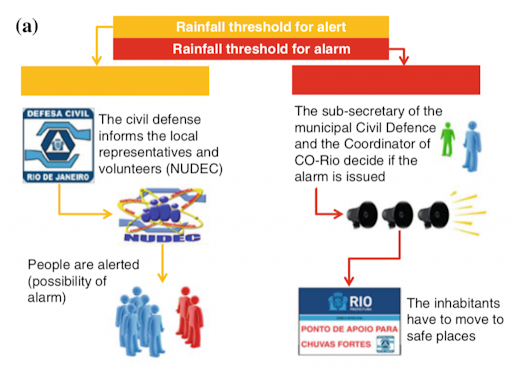
Following major landslide and flash flooding events in 2010 and 2011, and a major mapping of risk areas in 2011, Geo-Rio added its latest update to the watch system: an audible early warning system called the Community-Based Alert and Alarm System, or A2C2. Under this A2C2 network, two levels of alert exist. One is “Alert,” which is triggered when a rain gauge reaches its threshold and informs Civil Defense agents about potential weather threats. Civil Defense agents then transmit information to favela community leaders and volunteers trained in City Hall natural disaster prevention programs. This level of the system does not include sirens, but rather involves sending information directly from the Civil Defense and COR to community leaders via SMS. The second level is “Attention” (transcribed in below as “alarm”), which informs the Civil Defense via text message that weather threats are imminent, and requires a correspondence between the sub-Secretary of the Civil Defense (currently Marcel Jabre Rocha) and the coordinator of COR. If the two bodies decide the impending rainstorm will result in landslides or flash flooding on a scale large enough to justify evacuation, sirens are activated and residents are required to move to emergency shelter points.
This two-level system was deployed in late 2011 and early 2012 in 103 different risk areas in Rio. In addition to the new audible system, 194 emergency points and 165 sirens, of which 83 have companion automatic rain gauges, were put in place in the 103 communities (as of March 2019). 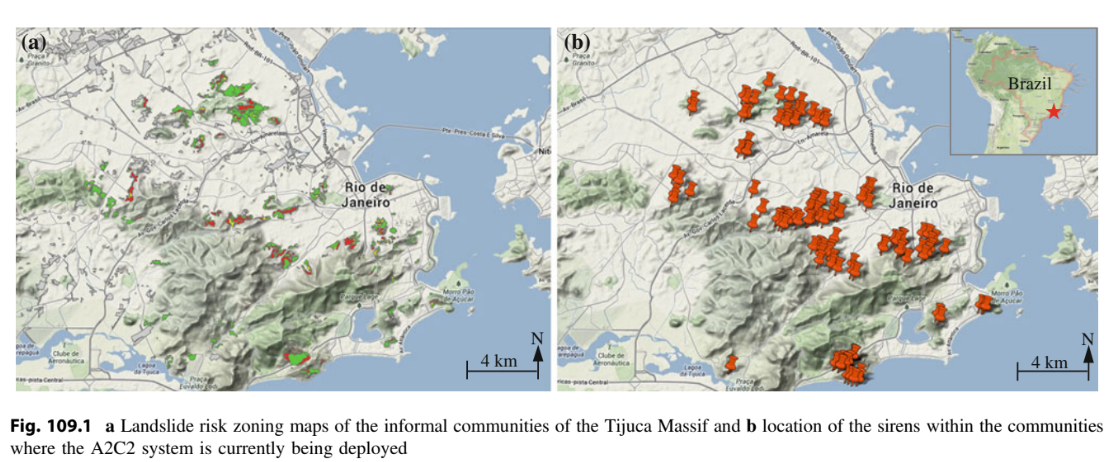
It is important to reiterate that warning sirens are not controlled or monitored by favela residents, but by the municipal government. Mariluce Mariá Souza, a community leader from Complexo do Alemão, is pessimistic about communication between City Hall and favela residents regarding floods and landslide events. While the City Hall website and several documents state that paid training programs have been put in place to coach favela community leaders in natural disaster prevention, mitigation and evacuation tactics and the A2C2 system, municipal hearings on flooding with the Civil Defense last June revealed that many programs had been discontinued with budgets cut in recent years. Souza stated that residents often don’t hear the sirens until it’s too late, when the rain has already been falling for hours. The Civil Defense did not respond to requests for comments to this article.
However, tactics are still being practiced. In 2018, among 103 high-risk areas in the city of Rio, an emergency simulation was performed in Itanhangá, in the community of Sítio Pai João. The simulation was one of many across the state. They took place in 11 municipalities, with 17 state and municipal agencies, 500 agents and volunteers and 2,300 families. Evacuation protocol was performed with SMS text messages, sirens, 30 community health agents, and community leaders for 520 different houses, and was carried out successfully.
Cause for Alarm
2011’s risk assessment, updated in 2013, is the most recent mapping conducted, even though several natural events have significantly altered the landscape of risk areas over the last eight years, compounded—especially in the city’s favelas—by rapid urbanization, poor sewage and sanitation systems, and shrinking budgets. Indeed, after an April landslide in the South Zone favela of Babilônia left two dead, the City noted that the local sirens had not activated because rain gauges had not reached the required rain threshold. Mayor Marcelo Crivella later vowed to revise activation indices.
Additionally, while city authorities have made attempts to reduce the number of missed alarms, the criteria for landslide mitigation also tends to produce a significant number of false alarms, generating a sense of distrust between at-risk communities and the system.
This makes landslide risk assessment more difficult: inaccurate mapping can lead to disoriented issues within geographical risk mitigation and further prevention of natural disasters, and a distrust of the system can disrupt the relationship between a community and its government, further lengthening the process of proper mitigation and prevention.
With both environmental and political factors coming into play in a discussion of natural disaster prevention, especially in areas like Rio’s favelas, it is increasingly essential to look at not only the systems currently in place to reduce risk, but more importantly, who is controlling them, especially when it seems that communities most prone to disaster are not able to evaluate their own level of vulnerability.
This article is part of a series analyzing landslide and flooding mitigation tactics currently being utilized in Rio de Janeiro, along with descriptions of more community-based warning systems already being tested in other countries prone to natural disasters from heavy precipitation.